

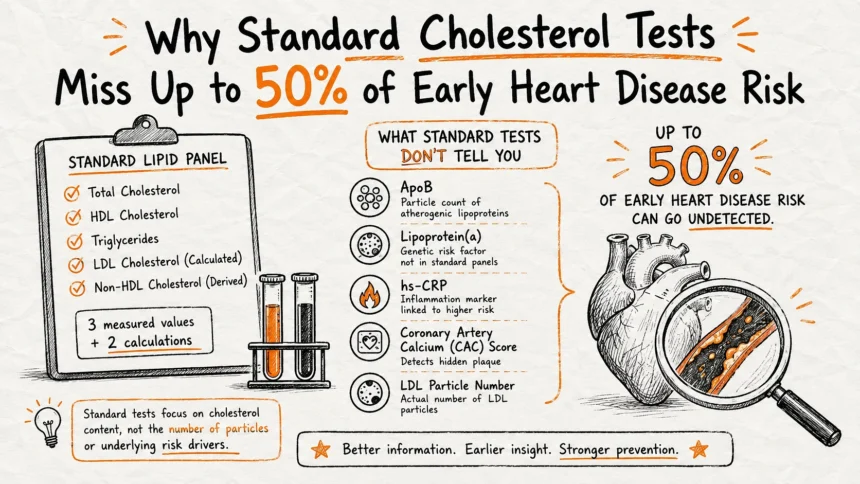
A standard lipid panel misses a large share of early heart disease risk because of what it counts. It weighs the cholesterol carried inside your particles rather than counting the particles themselves, and those two figures disagree in a meaningful minority of people. It skips lipoprotein(a) entirely, which around one adult in five carries at levels linked to early heart attacks. It skips inflammation, which predicts cardiovascular death better than LDL does in patients already on statin therapy. And the LDL figure on your report is usually not measured at all, it comes out of an equation published in 1972.
What a Standard Lipid Panel Actually Measures
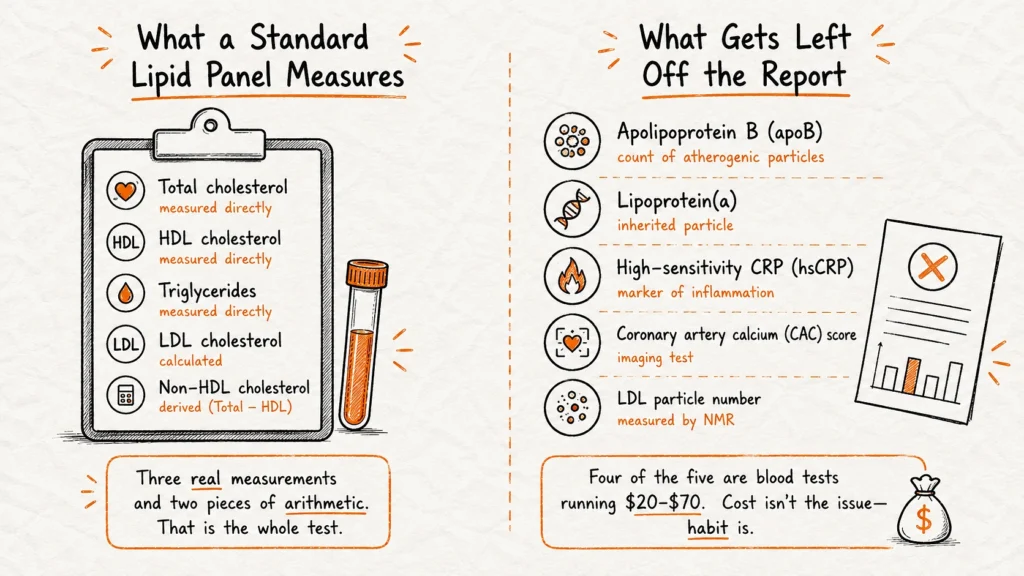
A routine lipid panel returns four measured or calculated values, plus one that most labs derive automatically:
- Total cholesterol, measured directly.
- HDL cholesterol, measured directly.
- Triglycerides, measured directly.
- LDL cholesterol, calculated in most labs rather than measured.
- Non-HDL cholesterol, derived by subtracting HDL from total.
Three real measurements and two pieces of arithmetic. That is the whole test.What Gets Left Off the Report
Five markers with strong evidence behind them do not appear unless somebody orders them separately:
- Apolipoprotein B (apoB), a count of atherogenic particles.
- Lipoprotein(a), an inherited particle type absent from routine bloodwork.
- High-sensitivity CRP (hsCRP), a marker of vascular inflammation.
- Coronary artery calcium (CAC) score, an imaging test rather than a blood draw.
- LDL particle number, measured by NMR.
Four of the five are blood tests running between twenty and seventy dollars. Cost is not what keeps them off the standard order set, habit is.Where the 50% Figure Comes From
The source is a 2009 paper in the American Heart Journal, led by Amit Sachdeva at UCLA Medical Center, working from the Get With The Guidelines database. The research team pulled admission lipid levels across 136,905 coronary artery disease hospitalizations at 541 hospitals, covering 2000 through 2006.
Their findings:
- Mean admission LDL of 104.9 mg/dL.
- Almost half of patients admitted with LDL below 100 mg/dL.
- Close to three quarters below 130 mg/dL.
- HDL below 40 mg/dL in 54.6% of the cohort.
- LDL below 70 combined with HDL at or above 60, considered the ideal pattern, in only 1.4%.
Those were people already in a hospital bed with confirmed coronary disease, carrying cholesterol numbers their physicians would have called acceptable.
The Two Caveats That Get Dropped
Every viral version of this statistic loses the same two details.
Only 21.1% of those patients were taking any lipid-lowering medication before admission. A large portion of the group were not people whose cholesterol had been successfully treated. They had never been treated at all, and their numbers happened to look unremarkable on paper.
The dataset also stops in 2006, with both LDL and HDL levels declining measurably across the study window. Quoting it as a description of current practice stretches it past what it can support.
The defensible reading a lipid panel does not miss half of all early heart disease. Half of the people who ended up hospitalized with coronary disease had passed a cholesterol screening. Two decades of follow-up work has kept that finding alive even as the specific figures aged.
Cholesterol Weight and Particle Count Are Different Numbers
How ApoB Works
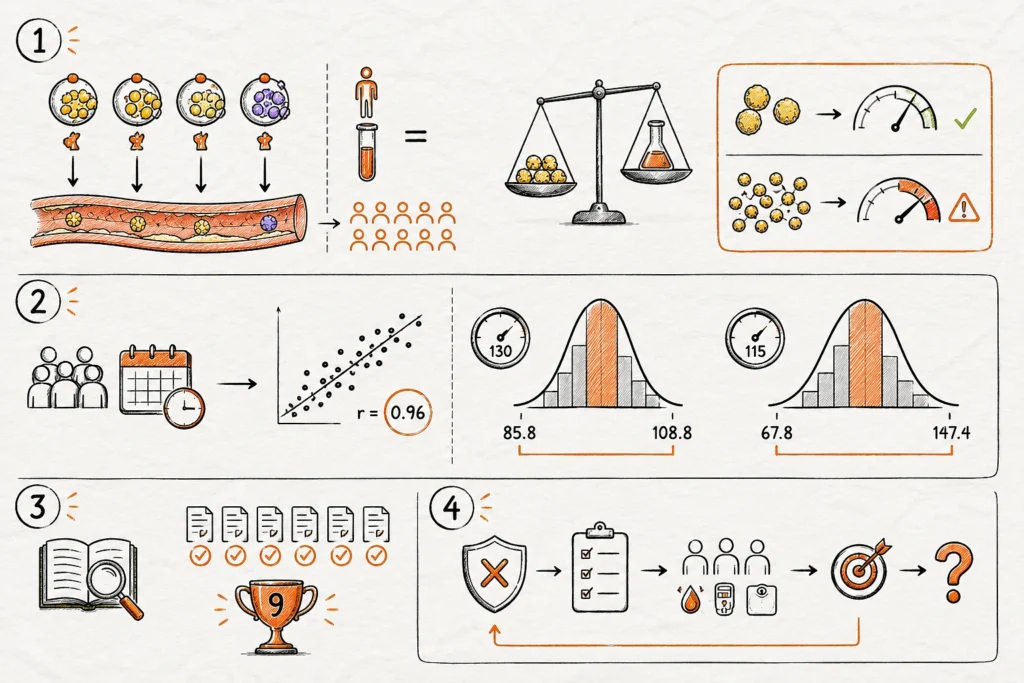
Every atherogenic particle in circulation carries exactly one apolipoprotein B molecule on its surface. LDL, VLDL, IDL and Lp(a) each get one. Measuring apoB gives you a headcount of the particles capable of lodging in an artery wall.
LDL-C measures something else. It reports the total weight of cholesterol packed inside your LDL particles, which is a cargo figure rather than a vehicle count.Someone carrying many small, cholesterol-poor LDL particles can produce a perfectly reasonable LDL-C result, because each particle holds less cholesterol than average. The weight looks fine. The particle count is high. Events track the particle count.
What Discordance Looks Like in Real Patients
Allan Sniderman and colleagues tested this against 293,876 UK Biobank adults, following them a median of 11 years for new-onset atherosclerotic disease. ApoB and LDL-C correlated at r = 0.96, which reads as near-interchangeable until you look at the spread.
Among people sitting at an LDL-C of exactly 130 mg/dL, the apoB range needed to capture 95% of them ran from 85.8 to 108.8 mg/dL. Hold triglycerides steady at 115 instead and the apoB spread widened to 67.8 through 147.4.
A 2025 systematic review in the Journal of Clinical Lipidology worked through the discordance literature using median-based, percentile-based, residual-based and variance-based methods. ApoB outperformed LDL-C in nine studies out of nine.
Is ApoB a Screening Test?
No, and the current guideline is careful about that. ApoB measurement is described as reasonable for deciding whether to intensify treatment once LDL-C and non-HDL-C goals have already been met, with particular value in patients who have elevated triglycerides, diabetes, obesity or metabolic syndrome. It answers a follow-up question, not the opening one.
Lipoprotein(a) Is the Biggest Blind Spot on the Panel
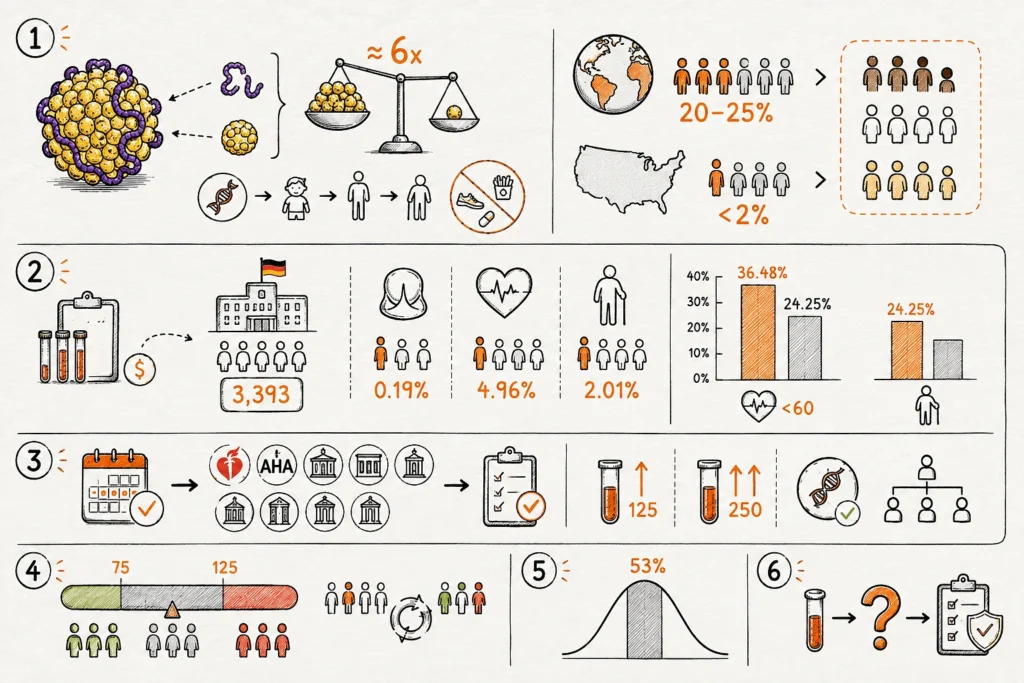
Lp(a) is an LDL particle with an extra protein, apolipoprotein(a), attached to its surface. It behaves roughly six times more atherogenically than an ordinary LDL particle. Levels are set almost entirely by genetics, reach adult values during childhood, and stay put for life no matter what you eat, how much you exercise, or which statin you take.
Between 20% and 25% of the global population carries elevated Lp(a), with higher prevalence in people of African ancestry than in white or Hispanic populations. Against that, fewer than 2% of Americans have ever had it measured.
Why It Never Shows Up on Routine Bloodwork
Lp(a) requires its own order and its own assay. Because it is not generally classified as a preventive service, insurance coverage stays inconsistent and patients often face cost-sharing on a test that costs most labs very little to run.
The consequence shows up clearly in one German dataset. A registry across MEDIAN rehabilitation facilities reviewed 3,393 patient records from people arriving for cardiac rehab after coronary intervention or aortic valve surgery.
- 0.19% of the aortic valve cohort.
- 4.96% of patients who had a heart attack before age 60.
- 2.01% of the older control group.
When the registry ran the test themselves, they found levels above 50 mg/dL in 36.48% of that early heart health group, against 24.25% among older controls. The patients most likely to be carrying elevated Lp(a) were the least likely to have been checked for it.
What the March 2026 Guideline Changed
On March 13, 2026, the ACC, the AHA and nine other organizations published a new dyslipidemia guideline that retired and replaced the 2018 blood cholesterol guideline.
Lp(a) should now be measured at least once during adulthood in every adult, as a Class 1 recommendation, the strongest designation a guideline issues. Previous US guidance limited testing to people with a family history of premature disease or unexplained personal history.
Key thresholds and rules:
- Elevated risk begins around 125 nmol/L, roughly 50 mg/dL.
- Observational data suggests risk approximately doubles above 250 nmol/L.
- One measurement suffices for most people, since levels are genetically fixed.
- Cascade testing applies, meaning a high result should trigger testing in first-degree relatives.
Reading a Gray Zone Result
One band deserves caution. The Cleveland Clinic Journal of Medicine flagged work from the Nashville Biosciences database in which about 53% of people in the intermediate gray zone, defined as 75 to 125 nmol/L, moved into a different guideline risk category when they were retested. Intraindividual assay variability of up to 20% has appeared in trial placebo groups.
A single gray zone draw is not a finished answer, and building a treatment plan on one is premature.Your LDL Number Is Calculated, Not Measured
Most laboratories do not measure LDL directly. They run the Friedewald equation:
LDL-C = Total cholesterol − HDL-C − (Triglycerides ÷ 5)
The fixed division by five assumes a constant ratio of triglycerides to VLDL cholesterol. That assumption survives in a lean, fasting patient with normal triglycerides and collapses in everyone else, always in the same direction. It underestimates.
| Triglyceride Level | Friedewald Underestimates LDL-C By |
|---|---|
| 150 to 199 mg/dL | 9.0 mg/dL |
| 200 to 399 mg/dL | 18.4 mg/dL |
Those comparisons against beta-quantitation appeared in the American Journal of Medicine in a paper on lipid profiling in obesity.
Push higher and accuracy falls off a cliff. Across 111,939 patients with triglycerides between 400 and 799 mg/dL, Friedewald assigned the correct LDL-C class 19.3% of the time. The extended Martin/Hopkins equation, which replaces the fixed factor with an adjustable one based on triglyceride and non-HDL-C levels, hit 62.1%.
Inflammation Predicts Death Better Than LDL in Statin Patients
Paul Ridker and colleagues at Brigham and Women’s Hospital pooled patient-level data from three trials, PROMINENT, REDUCE-IT and STRENGTH, covering 31,245 patients either living with atherosclerotic disease or at high risk for it, all on contemporary statin therapy.
The question was which residual risk carried more weight, the inflammatory kind measured by hsCRP or the cholesterol kind measured by LDL-C. Comparing highest quartile against lowest, the Lancet analysis reported:
- hsCRP: hazard ratio 1.31 for major adverse cardiovascular events, 2.68 for cardiovascular death, 2.42 for all-cause death
- LDL-C: hazard ratio 1.07 for major events, which missed statistical significance, along with 1.27 for cardiovascular death and 1.16 for all-cause death
Among patients already taking a statin, LDL-C showed essentially no relationship with future major cardiovascular events. Inflammation showed a strong one. Cardiovascular death risk ran high in patients with elevated hsCRP and low LDL, and low in patients showing the reverse pattern. The 2025 ACC scientific statement on inflammation reproduced that figure directly.
Editorialists raised a fair objection: the analysis did not separate primary from secondary prevention, and the two sets of hazard ratios came from different models. Joint-effects models in the appendix pointed the same direction. The case is less settled than the apoB discordance work, and it should not be presented as closed.
Ridker’s framing has stayed consistent since 2023. Lower LDL is still better, none of this argues otherwise, but treating cholesterol alone leaves a great deal of risk untouched. An hsCRP test costs roughly what a lipid panel costs.
Coronary Artery Calcium Scoring Now Carries a Class 1 Recommendation
CAC scoring uses a non-contrast gated CT to quantify calcified plaque in Agatston units, ranging from 0 for no detectable plaque to 1000 or above for extensive disease. The 2026 guideline upgraded it from Class 2a to Class 1 for risk stratification beyond the PREVENT-ASCVD equations.
How it applies:
- Recommended selectively for men over 40 and women over 45 at borderline or intermediate 10-year risk.
- Any detectable calcium supports an LDL-C goal below 100 mg/dL.
- Higher scores drive that target lower still.
The guideline packages this as the CPR model: Calculate 10-year risk using PREVENT-ASCVD, Personalize against factors the equation cannot capture, then possibly Reclassify with CAC and Reassess treatment.
LDL-C and non-HDL-C treatment goals also returned after being dropped in 2018:
- Below 55 mg/dL for clinical ASCVD at very high risk.
- Below 70 mg/dL for clinical ASCVD not at very high risk.
A calcium score of zero at 50 reassures in a way no blood test can, because it looks at the artery itself rather than at a proxy for what might be happening inside it. It also involves radiation, costs between roughly $99 and several hundred dollars depending on location, and cannot detect soft non-calcified plaque, which happens to be the plaque a 38-year-old would have.
Which Test to Add First
ApoB is the stronger test on evidence alone. Discordance data supporting it beats anything backing hsCRP or CAC. What apoB mostly tells you, though, is how hard to push therapy you are already receiving, which refines a decision rather than opening a new one.
Lp(a) does something different. It identifies a risk factor you were born with, that no behavior will modify, that a fifth of the population carries, that changes how aggressively every other number should be managed, and that you measure once in a lifetime for about the price of a takeout dinner.
The awkward part: no approved drug lowers it yet. Pelacarsen, olpasiran and lepodisiran sit in phase 3 with no outcomes readout. A high result currently hands the patient a number without a lever, which some clinicians treat as reason enough to skip the test. I find that unpersuasive, partly because patients who learn they carry elevated Lp(a) tend to get everything else managed harder, and observational data has shown lower mortality among tested ASCVD patients than untested ones. That finding is observational, and people who receive more testing tend to receive more of everything, so it carries only so much weight.