

Takeaway
Your lipid panel describes what is dissolved in your blood. Your CBC describes the blood itself its thickness, the condition of the cells suspended in it, how ready they are to clot, and how much inflammation is running underneath.
Cardiovascular risk is built from both. Four values you have already paid for, on a test you have already taken, carry information that the cholesterol number cannot supply. Read them.
Almost nobody reads their CBC. It arrives as a wall of abbreviations, the doctor says nothing is flagged, and attention moves to the cholesterol numbers where the interesting story supposedly lives.
That habit costs you something. A complete blood count measures the physical properties of the fluid moving through your arteries: how thick it is, how easily the cells inside it deform to squeeze through capillaries, how inclined your platelets are to clump, and how much low-grade inflammation is running in the background. A lipid panel measures none of that. It measures cargo, not flow.
Both matter. Plaque narrows the pipe, and blood viscosity determines how hard the heart works to push fluid through it. The tests answer different questions and neither substitutes for the other.
Hematocrit And Hemoglobin: How Thick The Blood Is
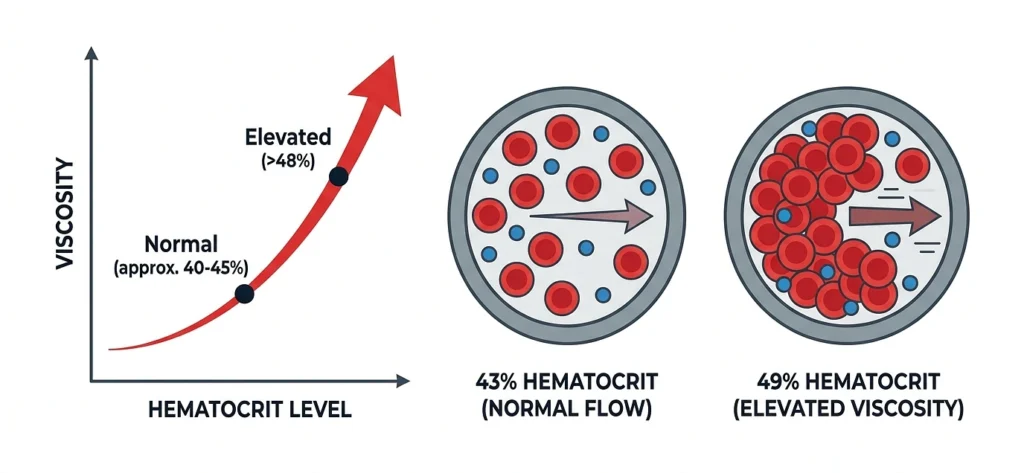
Hematocrit is the percentage of your blood volume occupied by red cells. It is the closest thing a routine panel offers to a viscosity measurement.
Thicker blood requires more pressure to move. The relationship is not gentle either. Viscosity climbs steeply as hematocrit rises past the mid-40s, so a value at the top of the reference range behaves quite differently from one in the middle, even though both print without a flag.
Why A High-Normal Result Gets Ignored
Reference ranges for hematocrit run roughly 41 to 50% in men and 36 to 46% in women health. Those ranges describe how the population distributes, not where risk begins. A man at 49% is inside the range and also carrying meaningfully thicker blood than a man at 43%.
Elevated hematocrit shows up with dehydration, sleep apnea, smoking, testosterone therapy, living at altitude, and occasionally a bone marrow disorder called polycythemia vera. Sleep apnea and testosterone are the two that matter most in practice, because both are common, both are correctable, and neither gets suspected from a blood test that nobody flagged.
The Low Side Has Its Own Problem
Anemia works in the opposite direction and is more dangerous in anyone with existing heart disease. Fewer red cells means less oxygen delivered per beat, and the heart compensates by beating faster and harder. In someone with coronary narrowing, that compensation is exactly the wrong demand to place on a heart that cannot increase its own blood supply.
Anemia independently predicts worse outcomes in heart failure and after heart attacks. It is also frequently the first sign of a gastrointestinal bleed, which makes it worth chasing rather than accepting.Red Cell Distribution Width: The Strangest Predictor On The Panel
RDW measures how much your red blood cells vary in size. It was included on the CBC for a narrow purpose, distinguishing types of anemia, and for decades nobody looked at it for anything else.
Then large cardiovascular studies started finding it near the top of their predictive rankings. Elevated RDW predicts mortality in heart failure, after myocardial infarction, and in the general population, independently of anemia, cholesterol, and conventional risk factors.
Nobody is entirely certain why. The leading explanation is that RDW acts as a general indicator of physiological disorder. Inflammation, oxidative stress, nutrient deficiency, and impaired kidney function all interfere with orderly red cell production, and the result is a population of cells with inconsistent sizes. RDW may simply be the cheapest available summary of how much stress the system is under.
How To Read It
Normal runs roughly 11.5 to 14.5%. Values above 15 warrant attention even when hemoglobin is normal, and the usual first checks are iron studies, B12, folate, thyroid function, and kidney function. Often something correctable turns up.
Platelet Count And Mean Platelet Volume
Platelets initiate clotting. When plaque ruptures inside an artery, platelets arriving at the tear are what convert a small injury into a blocked vessel.
The count alone tells you relatively little unless it is clearly abnormal. Mean platelet volume is more informative and gets read far less.
MPV measures average platelet size, and size tracks reactivity. Larger platelets are younger, denser with granules, and more aggressive at aggregating. Elevated MPV has been associated with worse outcomes after heart attacks and with higher event rates in general.
The honest caveat is that MPV is fragile as a measurement. It drifts upward in the collection tube, so a sample that sat before processing reads higher than the same blood analyzed promptly. Different analyzers produce different values. Treat a single elevated MPV as a prompt to repeat rather than as a finding, and compare results only within the same lab.
Neutrophil-To-Lymphocyte Ratio: Free Inflammation Data
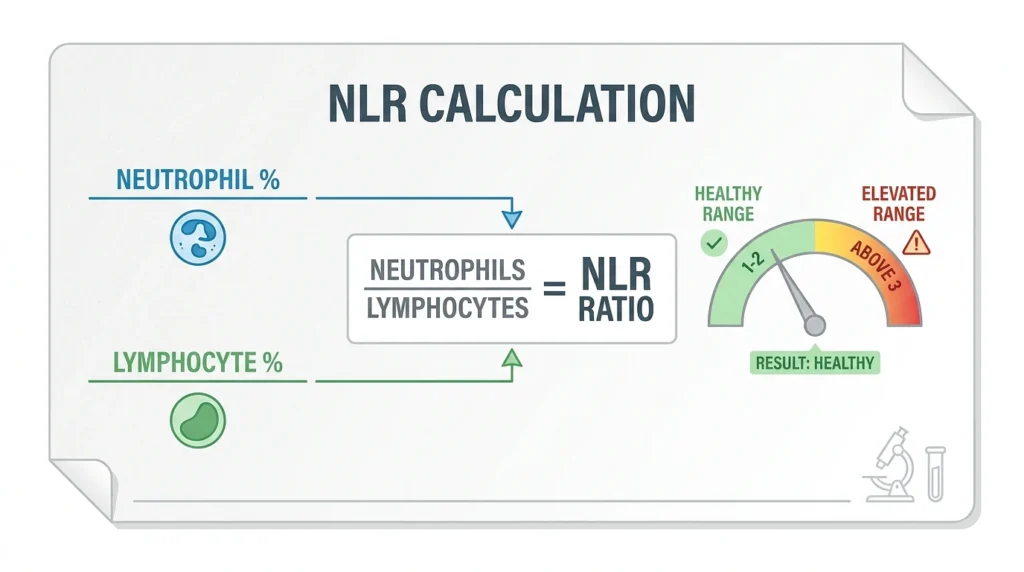
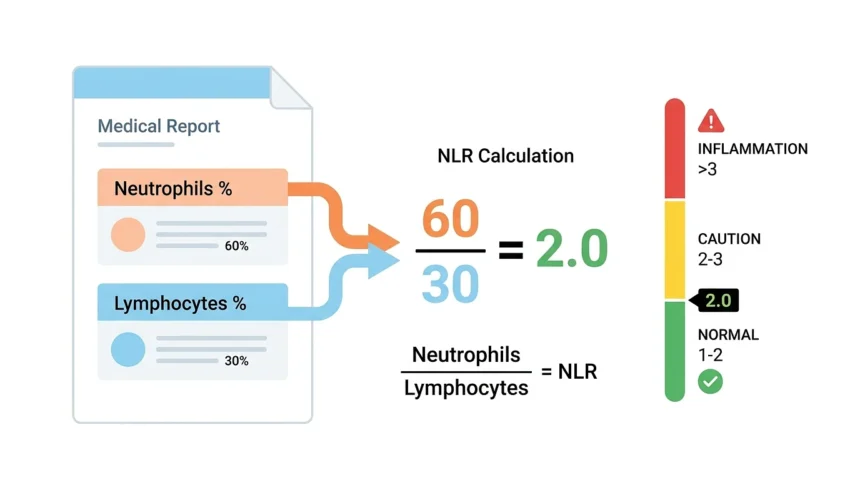
Your CBC differential lists neutrophil and lymphocyte percentages. Divide the first by the second and you have the neutrophil-to-lymphocyte ratio, one of the better-studied inflammatory markers in cardiovascular medicine and one that appears on no lab report because the machine does not calculate it.
Neutrophils rise with acute stress and inflammation. Lymphocytes fall with sustained physiological stress and cortisol exposure. The ratio captures both movements at once, which makes it more sensitive to chronic low-grade inflammation than either count alone.
Values around 1 to 2 are typical in healthy adults. Sustained values above 3 have been associated with worse cardiovascular outcomes across a range of populations.What It Does And Does Not Do
NLR is nonspecific in the same way hs-CRP is. Acute illness moves it. So does hard training, poor sleep, and psychological stress. A single reading during a cold means nothing.
Its value is as a trend. If you have several CBCs in your records from different years, calculating the ratio for each takes a few minutes and shows you whether your baseline inflammatory state has been drifting upward. That is information you already paid for and never received.
Putting The Two Panels Together
Neither test replaces the other, and the useful reading comes from looking at them side by side.
Consider a man with an LDL of 105, a CBC that nobody flagged, and a family history of early heart disease. His hematocrit reads 49, his RDW is 15.2, and his neutrophil-to-lymphocyte ratio works out to 3.4. The lipid panel says his risk is moderate. The CBC says his blood is thick, his red cell production is disordered, and he is running chronic inflammation. That is a materially different clinical picture than the cholesterol number alone conveys, and every value producing it was already sitting in his chart.
The reverse case is just as common. Someone with a high LDL, a clean CBC, low inflammation, and normal viscosity is carrying a different kind of risk than the numbers first suggest.
How To Read Your Own
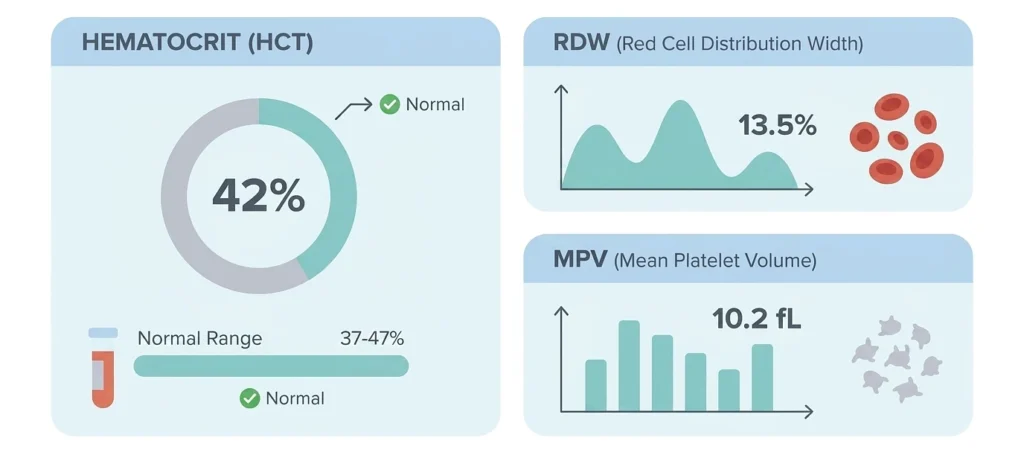
Pull your last CBC. Most portals keep several years of results.
- Hematocrit. Note where it falls in the range, not just whether it was flagged. High-normal in someone who snores or uses testosterone deserves a conversation.
- RDW. Above 15 with normal hemoglobin means something is interfering with red cell production. Iron, B12, folate, thyroid, kidney.
- MPV. Elevated once means repeat it. Elevated consistently at the same lab means mention it.
- NLR. Neutrophil percentage divided by lymphocyte percentage. Calculate it for every CBC you have and look at the direction of travel.
None of these are diagnostic on their own. All of them are context, and context is what turns a lipid panel from a number into a decision.